Prometheus configuration
Prometheus is an open-source monitoring system that has some interesting features for event monitoring and alerting. You can find a more detailed description at https://prometheus.io/.
This endpoint has been included in OpenKM since v8.1.10. To enable it, you need to include these two lines in the openkm.properties configuration file:
management.endpoints.web.exposure.include=info,health,prometheusOnce modified, you need to restart OpenKM and the endpoint http://localhost:8080/openkm/actuator/prometheus will be available. This endpoint is protected and will only be accessible to users with the ROLE_ACTUATOR or ROLE_ADMIN roles.
Setup validation
Section titled “Setup validation”In order to verify that access is valid, open a terminal and execute this command:
$ http -v --auth okmAdmin:admin http://localhost:8080/openkm/actuator/prometheus$ curl -v --user okmAdmin:admin http://localhost:8080/openkm/actuator/prometheusIf the username and password match, and the user has the ROLE_ACTUATOR role, the output will be something like:
# HELP tomcat_global_request_max_seconds# TYPE tomcat_global_request_max_seconds gaugetomcat_global_request_max_seconds{name="http-nio-0.0.0.0-8080",} 0.449tomcat_global_request_max_seconds{name="ajp-nio-127.0.0.1-8009",} 0.0# HELP jvm_threads_peak_threads The peak live thread count since the Java virtual machine started or peak was reset# TYPE jvm_threads_peak_threads gaugejvm_threads_peak_threads 128.0# HELP system_cpu_usage The "recent cpu usage" for the whole system# TYPE system_cpu_usage gaugesystem_cpu_usage 0.04721888755502201Running Prometheus with Docker
Section titled “Running Prometheus with Docker”The easiest way to get Prometheus running is to use the Docker image, so we need to get it:
$ docker pull prom/prometheusOnce we have the image, we need to create the prometheus.yml configuration file:
global:  scrape_interval:     15s # Set the scrape interval to every 15 seconds. Default is every 1 minute.  evaluation_interval: 15s # Evaluate rules every 15 seconds. The default is every 1 minute.  # scrape_timeout is set to the global default (10s).
# Load rules once and periodically evaluate them according to the global 'evaluation_interval'.rule_files:  # - "first_rules.yml"  # - "second_rules.yml"
# A scrape configuration containing exactly one endpoint to scrape:# Here it's Prometheus itself.scrape_configs:  # The job name is added as a label `job=<job_name>` to any timeseries scraped from this config.  - job_name: 'prometheus'    # metrics_path defaults to '/metrics'    # scheme defaults to 'http'.    static_configs:    - targets: ['127.0.0.1:9090']
  - job_name: 'spring-actuator'    metrics_path: '/openkm/actuator/prometheus'    scrape_interval: 5s    static_configs:    - targets: ['172.18.0.1:8080']    basic_auth:      username: 'okmAdmin'      password: 'admin'
Let’s create the appropriate Docker Compose file:
version: '3.2'
services:
  prometheus:    image: prom/prometheus    container_name: prometheus    hostname: prometheus    command:      - "--config.file=/etc/prometheus/prometheus.yml"    ports:      - 9090:9090    volumes:      - ./prometheus.yml:/etc/prometheus/prometheus.yml
And you can start it by:
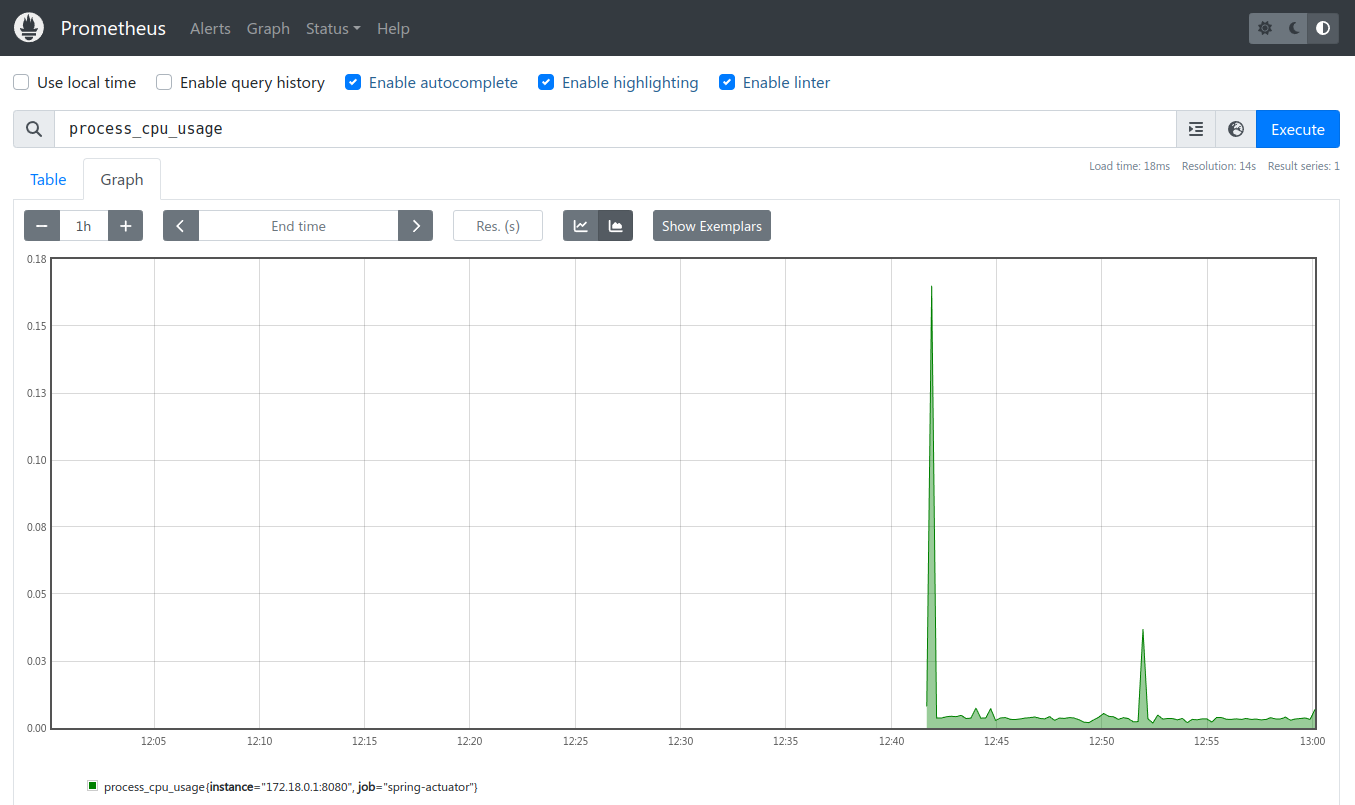
$ docker-compose up -dOnce started, Prometheus will be accessible at http://localhost:9090/ and you can see a graph of application CPU usage filtered by “process_cpu_usage”:
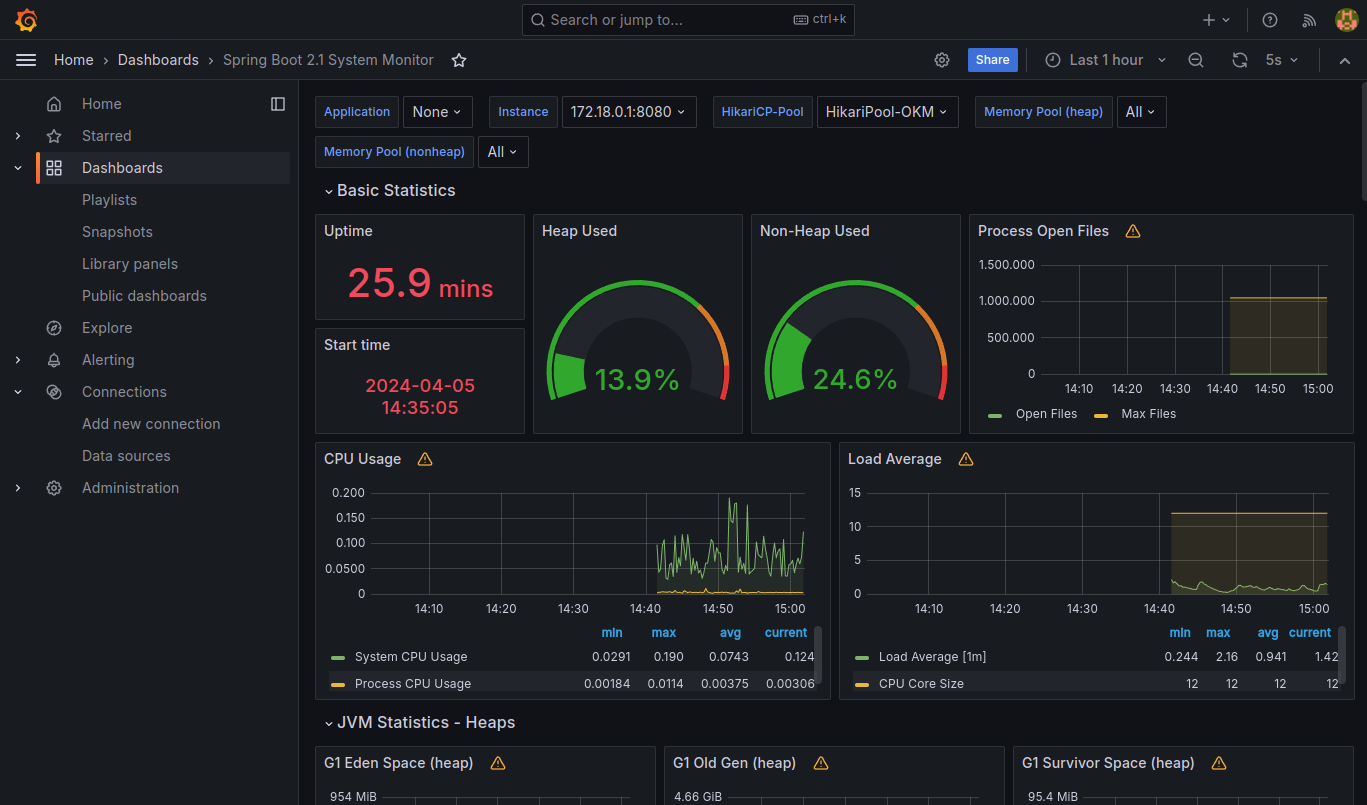
Grafana will be available at http://localhost:3000/ and to log in, use “admin” as the default username and password. Go to “Data sources” and add a Prometheus data source using the URL http://172.18.0.1:9090. To create a sample dashboard, go to Dashboard and click the “Create Dashboard” button. After that, click “Import dashboard” and choose the “Spring Boot template” which has the id 11378. Use the previously created Prometheus data source.
More information is available on the Prometheus and Grafana websites.